
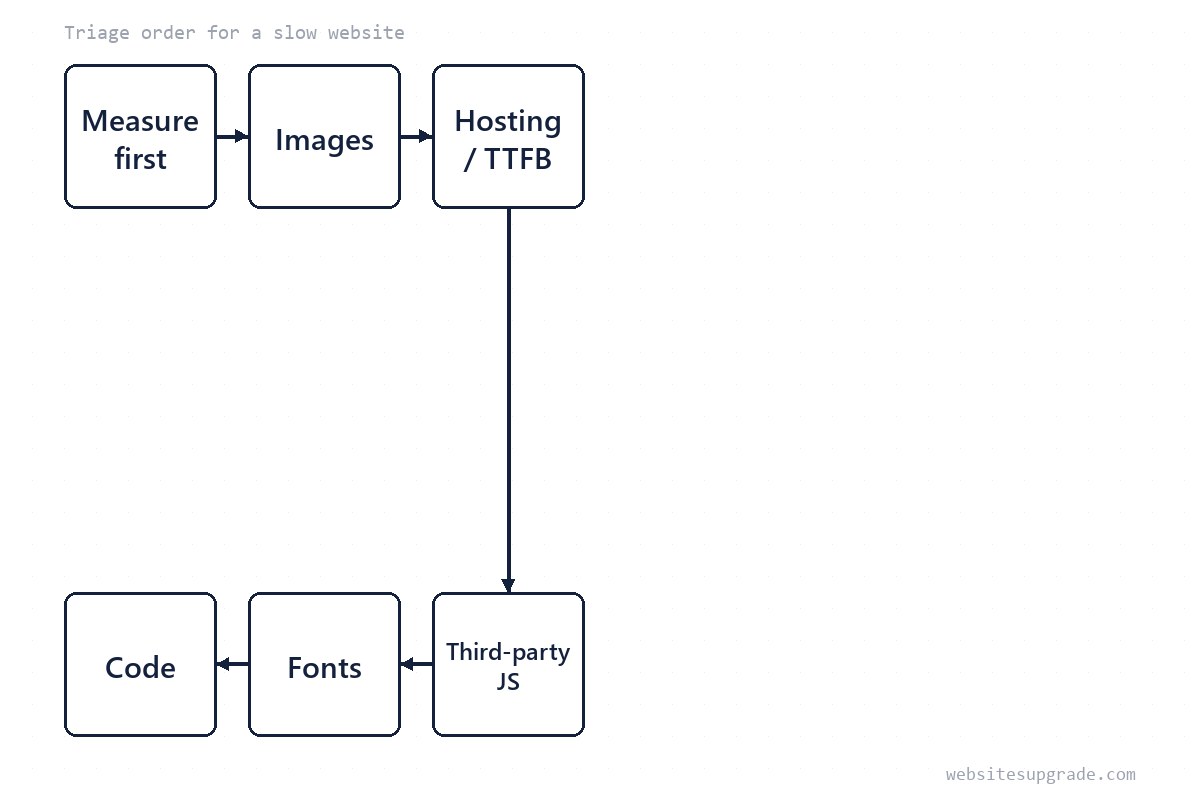
Your site takes six seconds to load and everyone has an opinion about why — the theme is old, the host is cheap, the photos are huge, the code is a mess. All four might be true, but only one of them is probably responsible for most of the delay, and guessing wrong is how a $200 problem becomes a $20,000 rebuild.
This guide gives you the order to investigate in — the same order a practitioner would use — so you can find the dominant cause, fix it, and stop. By the end you will know which of five culprits is yours and what the fix typically involves. For deeper dives, see our other guides.
Step 1: Measure before you change anything
Go to PageSpeed Insights (pagespeed.web.dev) and test your three most-visited pages, not just the homepage. Two numbers matter for triage:
- Largest Contentful Paint (LCP) — when the main content appears. Good is 2.5 s or less, measured at the 75th percentile of real visits, as of 2026.
- Time to First Byte (TTFB) — how long your server takes to start answering. It is reported in the lab section; anything consistently above roughly 800 ms points at hosting or a slow CMS back end.
Also note INP (interactivity; 200 ms or less is good) and CLS (layout stability; 0.1 or less). A page can load fast and still feel broken — keep those two in view, but for a "6-second" complaint LCP is nearly always the metric that failed.
Write the numbers down. They are your before/after evidence and the only way to know a fix worked.
Step 2: Images — the most common cause by far
Scroll the PageSpeed report to "Opportunities." If you see "Serve images in next-gen formats", "Properly size images", or "Efficiently encode images" with savings measured in seconds, that is your answer.
The typical failure: a phone photo or stock image uploaded at 3000+ pixels wide, weighing 2-5 MB, displayed in a 700-pixel slot. The fix is boring and cheap:
| Symptom in the report | Fix | Typical effort | Typical cost |
|---|---|---|---|
| Images over ~500 KB each | Re-encode as JPEG/WebP at display size | 1-2 hours for a small site | Free (tools only) |
No srcset / oversized for mobile |
Resize or regenerate thumbnails | Half a day | Free–low |
| Offscreen images loading eagerly | Add loading="lazy" / CMS setting |
Under an hour | Free |
| Hero/LCP image arriving late | Preload the LCP image | Under an hour | Free |
When not to do this first: if your images are already under ~250 KB each and the report's biggest opportunity is elsewhere, skip ahead.
Step 3: Hosting and TTFB — the second-most-common cause
If PageSpeed shows a TTFB consistently over ~800 ms, your server — not your page — is the bottleneck. On shared hosting this usually means an overloaded server or a CMS doing heavy work per request (page builders, plugin stacks, un-cached database queries).
Options, cheapest first: enable your host's page caching or a caching plugin; upgrade one hosting tier; move a truly static site behind a CDN like Cloudflare's free plan so HTML is served from a nearby edge node. For many small sites, full-page caching takes TTFB from 1-2 seconds to under 200 ms without changing hosts at all.
When not to upgrade hosting: if TTFB is already fine, more expensive hosting buys you nothing.
Step 4: Third-party scripts — the quiet killer
Chat widgets, analytics suites, ad pixels, social embeds, font CDNs. Each adds DNS lookups, TLS handshakes, and main-thread work, and the cost compounds. PageSpeed's "Reduce the impact of third-party code" audit lists them with transfer sizes and blocking time.
Audit every script and ask: do we still use this? Remove what you do not use, delay what is not needed at load (chat widgets can wait until interaction), and self-host what you can — our guide on self-hosting fonts is the most common quick win here.
When not to remove scripts: an analytics or consent tool you genuinely rely on stays — the goal is cutting waste, not going blind.
Step 5: Fonts and code — usually smaller levers
Web fonts from a third-party CDN add a connection chain before text renders; font-display and self-hosting fix most of it in under an hour. Render-blocking CSS and JavaScript show up as "Eliminate render-blocking resources" — real but usually worth single-digit tenths of a second, not three seconds.
When not to bother: if steps 2-4 already brought LCP under 2.5 s, chasing the remaining 200 ms has poor ROI for most business sites.
What six seconds is usually made of
It helps to know the typical anatomy of a slow page before you start, because the triage order above mirrors where the seconds actually live. On a small business site, a rough breakdown that holds up surprisingly often: 1-3 seconds is server time (TTFB) on an uncached CMS or crowded shared host; 1-3 seconds is media, mostly oversized hero and gallery images; and the rest is third-party scripts competing for the browser's main thread. Code quality — the thing everyone blames first — is usually responsible for the smallest slice.
That is also why "we need a new website" is the wrong first conclusion. Two of the three big slices are configuration problems, not architecture problems. A site that is six seconds because of uncompressed images and no page cache is one weekend away from three seconds with zero redesign. Reserve the rebuild conversation for the case where the CMS itself — not its content — is the bottleneck even after caching, or where the fixes above collide with a platform you cannot control.
The triage checklist
Work this list top to bottom and stop when your numbers are green:
- Run PageSpeed Insights on your three most-visited pages; record LCP, TTFB, INP, CLS.
- If image opportunities total >1 s, fix images first and re-test.
- If TTFB is consistently >800 ms, fix caching/hosting before touching the page.
- Remove or defer every third-party script you do not actively use.
- Self-host fonts and set
font-display; only then look at render-blocking code. - Re-test the same three pages and compare against step 1 — the numbers, not opinions, decide whether you are done.
A note of caution for the rebuild-minded: a six-second site is a symptom, not a verdict. If step 3 shows your CMS itself is the bottleneck even with caching, that is when bigger upgrade questions — platform, architecture, rebuild — legitimately enter the conversation. Everything above still applies afterward.
— Editorial team. Facts current as of 2026; we revise guides when the ground shifts.
Frequently Asked Questions
Is 6 seconds really that bad?
As of 2026, Google's Core Web Vitals guidance calls Largest Contentful Paint over 2.5 seconds 'needs improvement' at the 75th percentile. A 6-second full load typically means an LCP well past that line, so yes — it is costing you visitors.
Do we need a developer to do this triage?
The first two steps — PageSpeed Insights and checking image sizes — need no developer. Steps three and four usually need whoever can touch your hosting account or CMS admin.
Should we just move to a faster host right away?
Only if your time-to-first-byte is the problem. Moving hosts when the real issue is 4 MB of images just relocates the problem. Measure first.